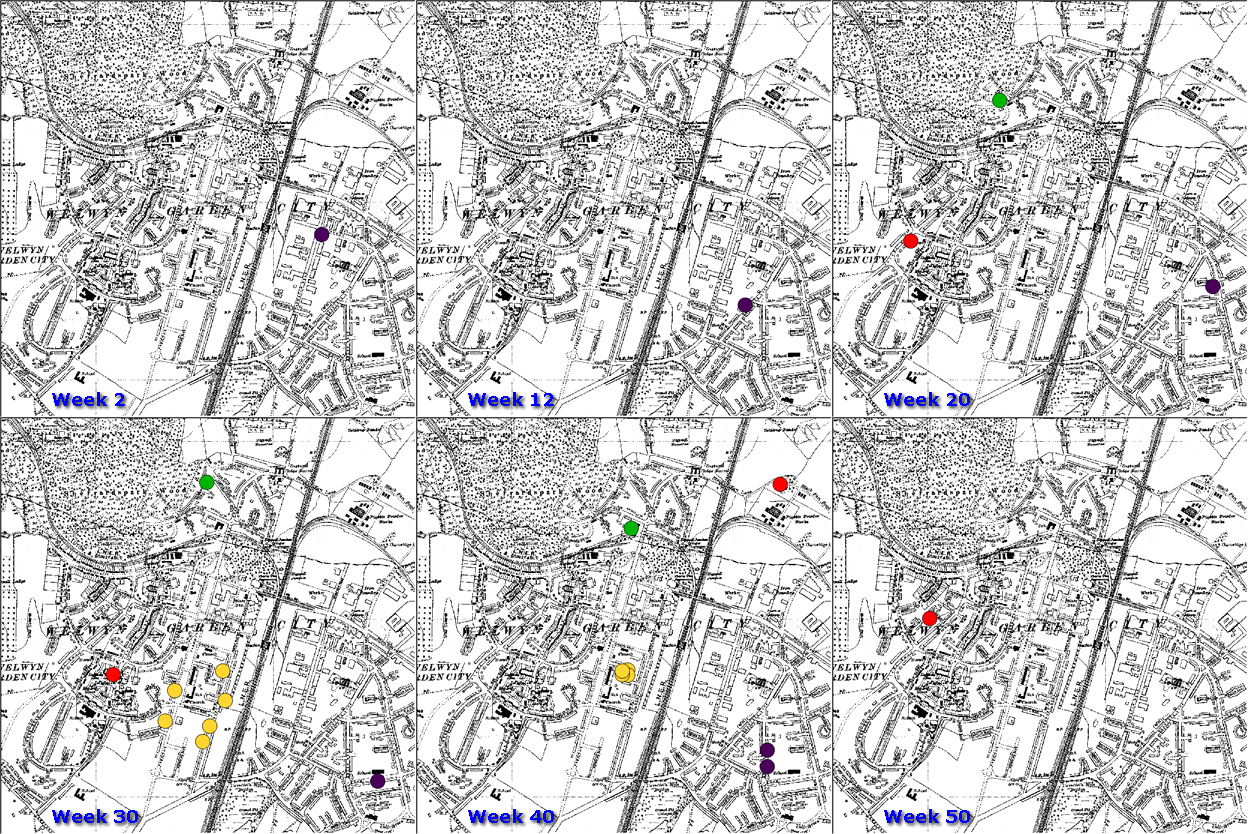
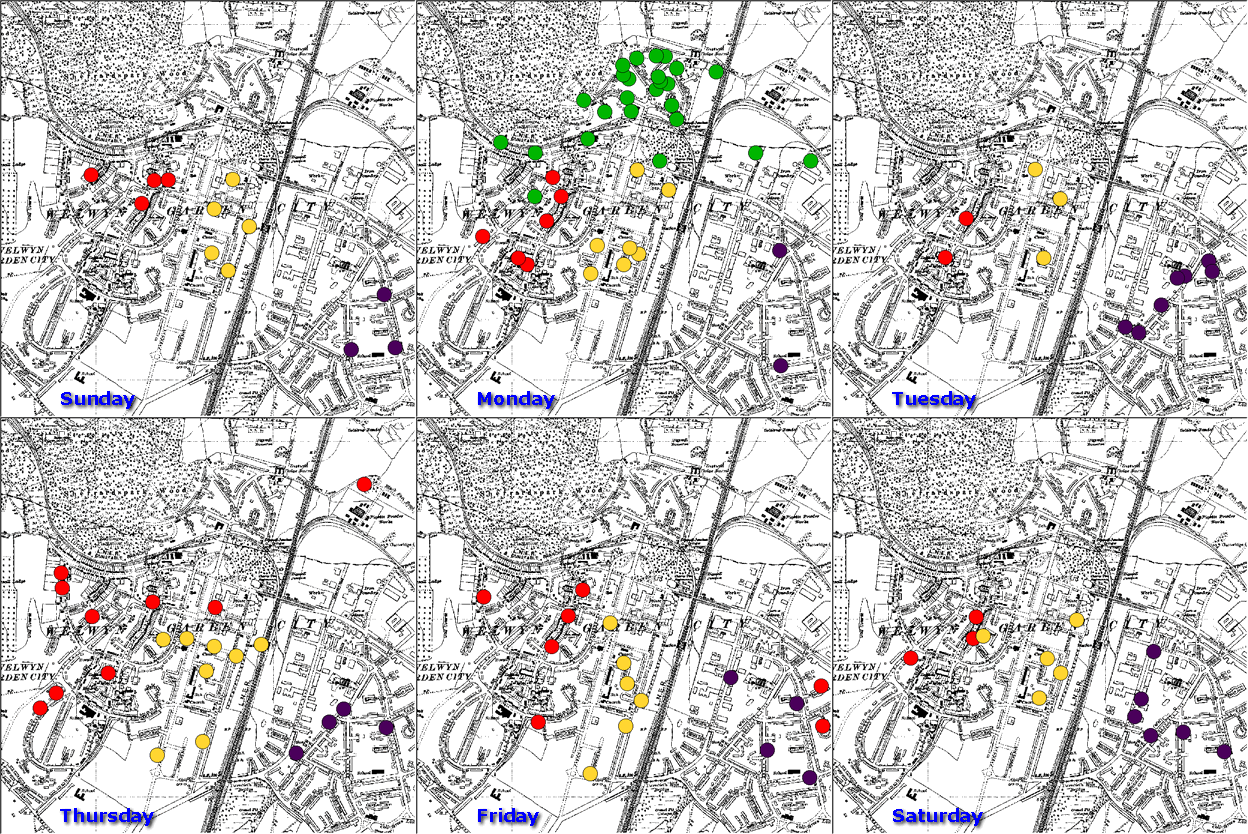
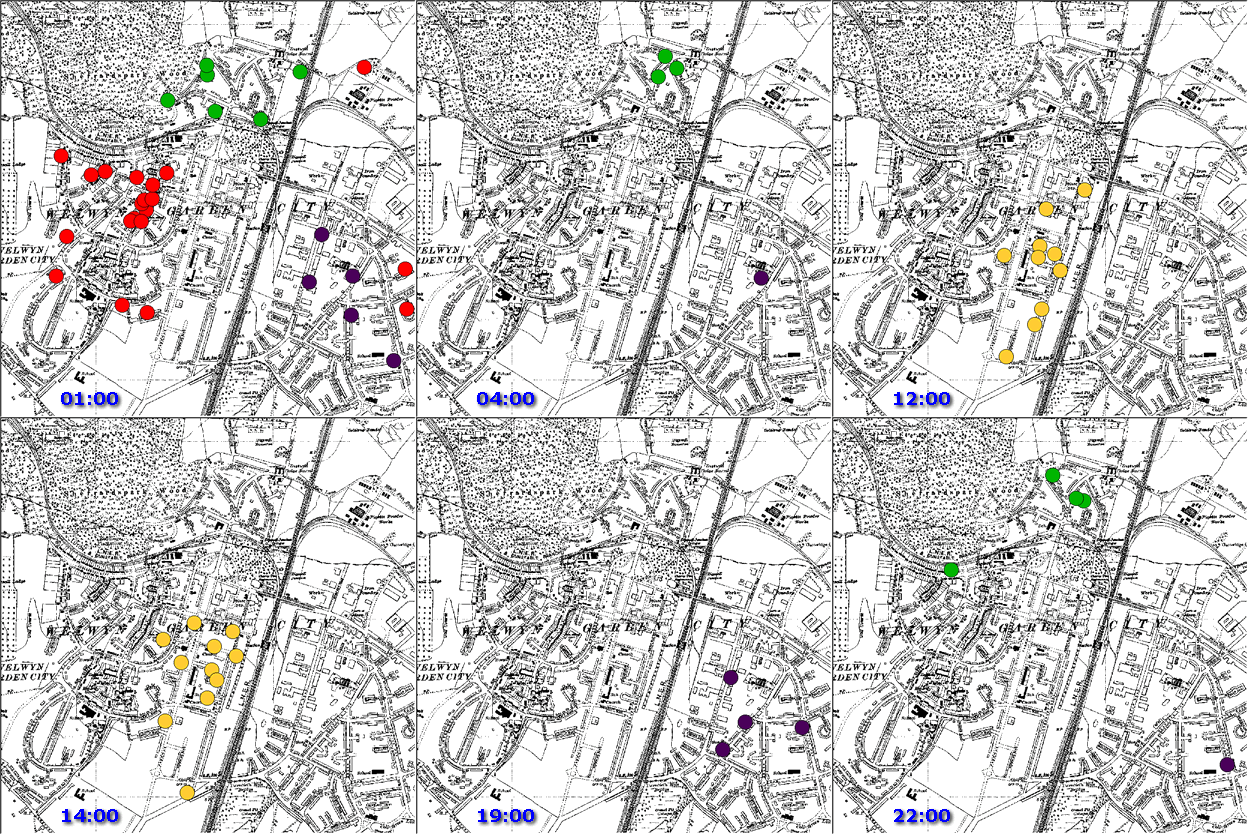
Animation of crime statistics data.
Figure shows simulated crime statistics, starring Ms Scarlet, Col Mustard, Rev Green and Prof Plum. These animations show three different ways of visualizing and analyzing the same data to deduce different facts about each of the robbers.
The top animation shows the full history of robberies shown as fortnightly timeslices. Here you can see that Prof Plum is systematically robbing along neighbouring streets and Col Mustard only robs during the summer when office windows are open.
The middle animation shows the same robberies but this time grouped using cyclical time slices as days of the week. From this animation you can tell that Rev Green only robs on Mondays.
The lower animation shows another cyclical animation, this time hours of the day. Here Col Mustard just robs during the lunchtimes when office workers are out to lunch. Prof Plum robs early evening while Rev Green and Ms Scarlet are night owls!
The backdrop image is a 1:10,560 raster map provided by Landmark and is copyright Ordnance Survey.
Technical detail. STEMgis stores all temporal data within a database. When the user retrieves these data they may choose any linear or cyclical timeslice they wish depending on how they wish to analyse their data. Once retrieved the temporal aggregation may be altered for any layer without having to retrieve the data again.


