Tutorial 3 - Creating CSV Files
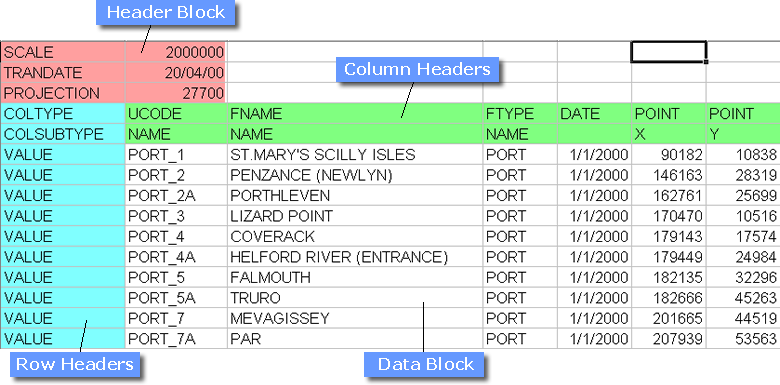
The main format used to load data into a STEMgis database is a CSV format. There are a number of different styles to the format but basically it follows the design shown below including, header block, row headers, column headers and data block. There are separate files for spatial and attribute data.
In this tutorial we will reformat some text and Excel Spreadsheet data that has been delivered to us from a number of sources. The data represent some water quality measurements that have been collected from several locations on rivers in the north of England.
This tutorial assumes that you have Microsoft Excel available and that you have some basic experience in using it. You can create CSV files using a text editor by inserting a comma between each 'column' value, however, the descriptions given here will be based on Excel.
Original Data
There are three files that we have been given. You can find these in the data\samples directory wherever you installed STEMgis. If you installed STEMgis in c:\Program Files\Discovery Software\STEMgis then you will find the files in c:\Program Files\Discovery Software\STEMgis\data\samples. They are called Cobalt.xls, Cobalt2.dat and Cobalt3.txt. Let's have a look at each in turn.
Cobalt.xls
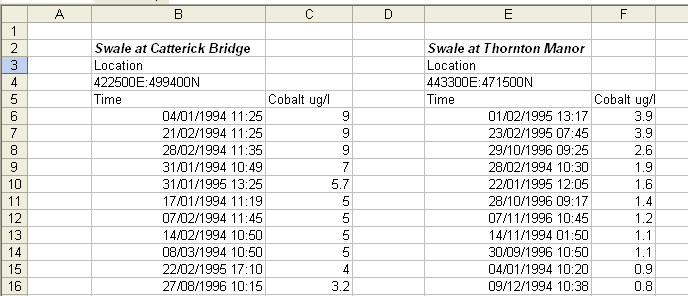
This file is an Excel spreadsheet and contains cobalt data for two sites on the Swale River. The locations are given as Eastings and Northings and the cobalt data is listed in columns sorted by the cobalt value and not by the date.
Cobalt2.dat
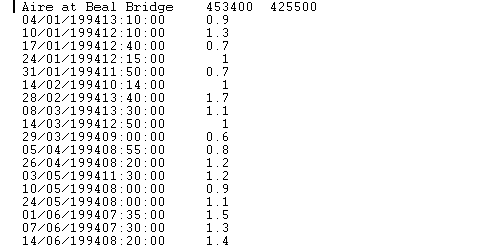
This file includes only one site. The easting and northing is shown in line 1. The date time and cobalt value are formatted in blocks of text. The data makes up the first 11 characters on each line, the time the next 13 characters and the cobalt value the next 3 characters. This dataset appears to be sorted by date and time.
Cobalt3.txt
 This file is tab delimited, where each individual data entry is separated by a Tab. The name of the site and the easting and northing are given. The date, time and value are sorted by date and time along each row rather than in a column.
Creating a Spatial CSV file
We could create several CSV files for this data, a spatial file and attribute file for each site. However, in this case we will combine all the sites into one spatial CSV file and all the cobalt data into one attribute CSV file.
One piece of information that we have been given by our colleagues is that the co-ordinates of each site have been given in OSGB36 - the British National Grid. Before compiling our spatial file, we need to find the correct code for this projection. If you look at the alphabetical projection list you will find that the OSGB36 code is 27700. You can also use the Set Projection tool in STEMgis Viewer to find the code you are looking for.
Open a new spreadsheet in Excel and create a header block and column headings containing:
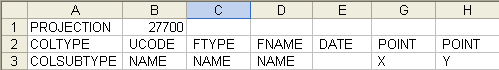
The PROJECTION line provides the projection code for all spatial data in a file.
Note: You cannot mix co-ordinates from different projections in a single file. However, you can have many spatial files for a particular dataset and each file can have a different projection code. When viewed on the map they will be displayed in whatever projection is currently being used in the Viewer.
Lines 2 and 3 describe the column headers. UCODE will contain the unique codes for each spatial object (i.e. in this case, each location on a river where measurements have been made). FTYPE will contain the Feature Type code and FNAME will contain the full name of each location. The DATE for each site must precede the date of any attributes for that site. The POINT columns will contain the X and Y co-ordinates for each site.
As the co-ordinates and names are littered through each of the 3 files the only solution is to copy and paste individual values into the appropriate field in the spreadsheet so that it looks like:
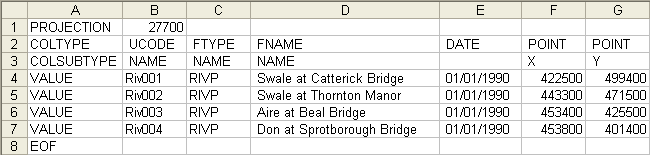
The UCODEs have been given a simple sequential alphanumeric codes. These codes cannot now be used for other spatial features and can only represent these river locations. We could in theory redefine their positions at a later point in time but in reality, barring an earthquake, these locations are not likely to move.
The FTYPE code is always a 4 letter code and is the same code that is used when defining the Feature Type, as we will see below.
As you can see the FNAME is a more user friendly description of the site. This will be seen by the user in STEMgis Viewer when visualizing the data.
In this example the DATE has been set to an arbitrary date preceding the attribute values which start in 1994. However, if we were defining the position of a vehicle or the limits of a town at a particular time then we would need to be more precise with our dates.
Note: The CSV files should always end with EOF in the first column of the last row.
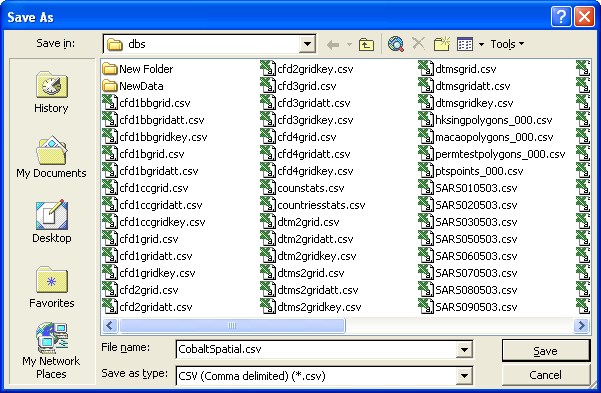
Save the spatial CSV file from Excel using File->Save As, making sure that the Save As Type is CSV (Comma Delimited):
Creating an Attribute CSV File
Next we will create an attribute CSV file. The column headers are similar. Create these in a new Excel Spreadsheet.
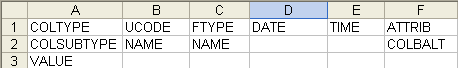
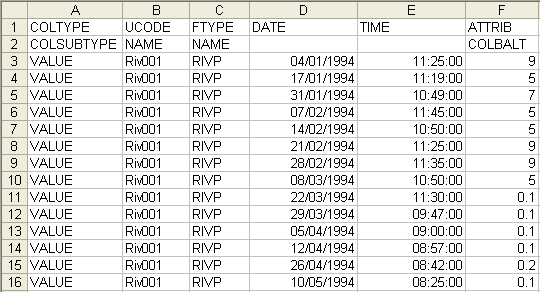
The UCODE and FTYPE will be the same for each location. The remaining columns will define the cobalt values and the date and time of each measurement. The COLSUBTYPE in the ATTRIB column refers to the code given in the attribute definition, see below.
Note: It is important that all data for one spatial feature appear in a contiguous block and that the block of data are sorted by date and time, where the earliest date comes first.
Now we must copy the cobalt and date/time data from the provided data files. Open the Cobalt.xls file in Excel. Copy cells B6 to C187.
Note: You can select this range by left-clicking on B6, then while holding the Ctrl and Shift keys down, press on the down arrow on the keyboard and then press the right arrow on the keyboard. You can copy this selected data into memory by pressing Ctrl-C (i.e. hold down the Ctrl key and press the C key).
Paste the data into our new spreadsheet.
Note: This can be done by left-clicking on cell E3 and pressing Ctrl-V.
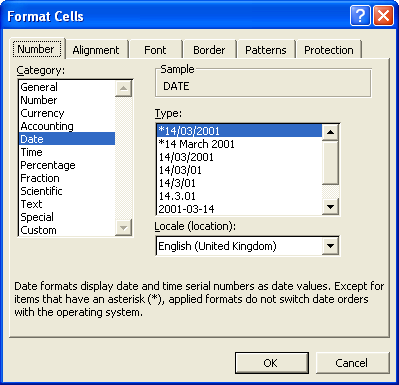
You will notice that at the moment the date and time data are in the same column and we need to separate the two. This can be done by copying the data/time data from the TIME column to the DATE column so that we have two copies of the same data. We can then format each column to just show date in one and time in the other. Select the DATE column by clicking on the letter D above the column. Then select Format->Cells and highlight Date in the Category list and click OK. Repeat for the TIME column and select Time as the category.
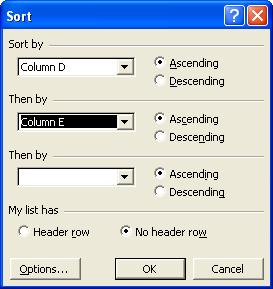
The DATE and TIME columns should now be formatted correctly. However, they are not sorted by date and time. To do this, select the data from cell D3 to F184. Then select Data->Sort. Select Column D as the first sort by column and select column E and the second. This will sort the data by date and if there are more than one values per day it will sort those values by their time.
Add the UCODE and FTYPE for this site for all of the data rows we have just added. The top few rows of your new spreadsheet should now look like:
Note: You cannot have duplicate rows in terms of UCODE, FTYPE, DATE and TIME. If you try to load a file with duplicates then STEMgis Manager will report this as an error and not load the file.
Repeat the above formatting for the second site in Cobalt.xls adding the data below the data for Riv001. Remember when sorting the data to only sort the data for the new site that you are adding!
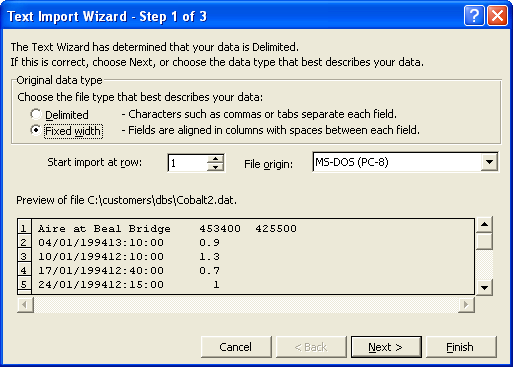
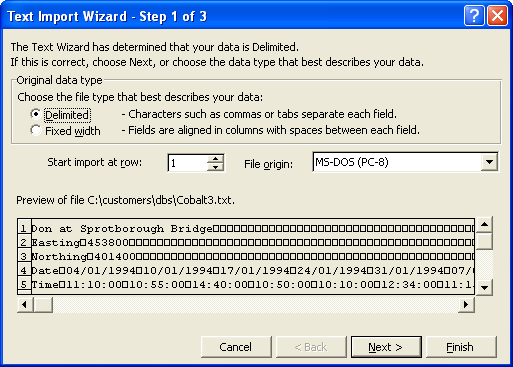
Move onto the second file: Cobalt2.dat. Load this file into Excel by selecting File->Open. Select the file and then select the Fixed Width radio button. Click Next.
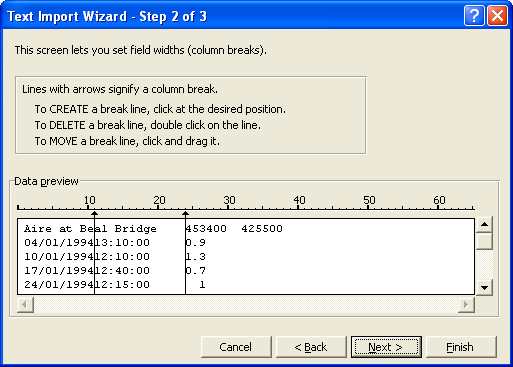
On the next form, left-click on character 11 (click just above the black arrow in the image shown below) to identify a new column (n.b. a column at character 24 will already have been identified by Excel. Click Finish. The data will appear in 3 columns in a new spreadsheet.
This data is now in the correct format and can be copied directly into our attribute CSV spreadsheet.
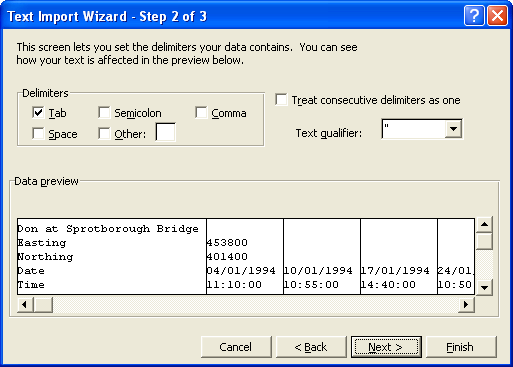
Move onto the third file: Cobalt3.txt. Load this file into Excel by selecting File->Open. Select the file and then select the Delimited radio button. Click Next.
Make sure that the Tab checkbox is checked and then click Finish.
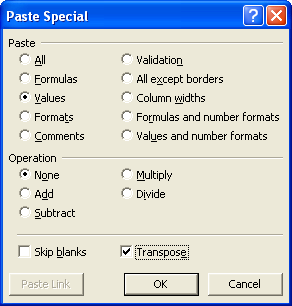
We now have a new spreadsheet where the data run across columns rather than down columns. Select the data in cells B4 to DY6. Copy into memory and when pasting into our CSV file select the first empty cell in column D and select Edit->Paste Special. Make sure that the Values radio button is selected and check the Transpose checkbox before clicking on OK.
After adding the UCODE and FTYPE for this latest site add an EOF row and you are finished.
Adding Feature Type and Attribute Definitions to the Database
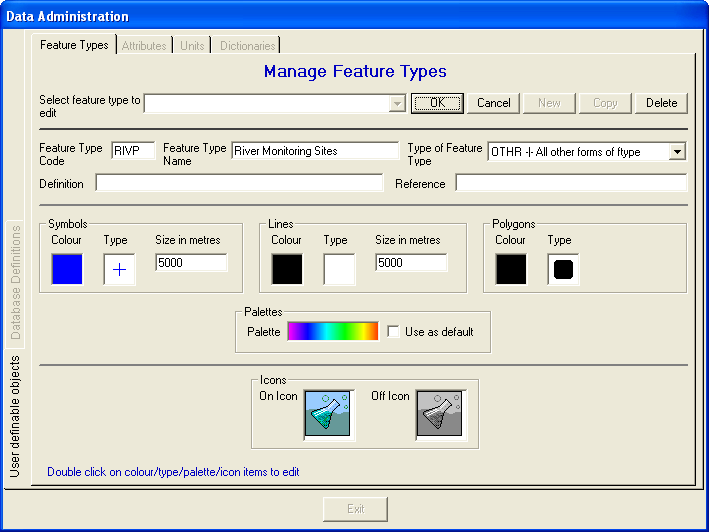
We saw in tutorial 2 how to add feature and attribute definitions. In brief open your database in STEMgis Manager. Go to Tools->Manage Features/Attribs etc and select the Feature Type tab. Fill out the form:
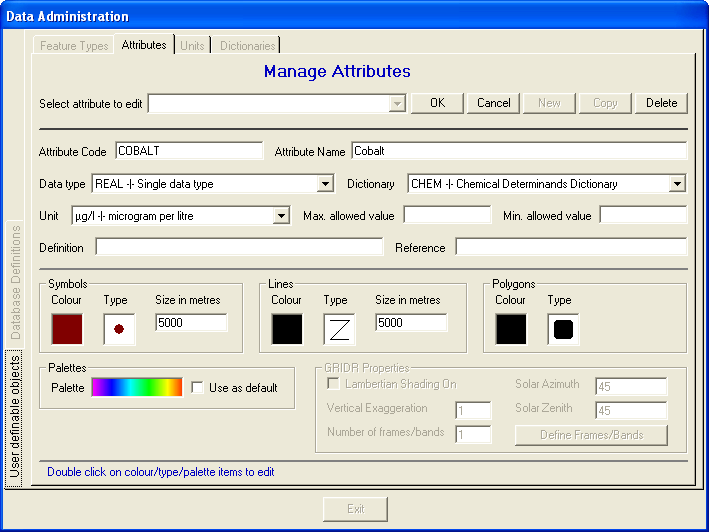
Similarly, add an attribute definition to look like:
You are now ready to load the two files.
Select Insert->Load File, remembering to load the spatial file before the attribute file.
Note: Data can often be as complicated as this when delivered to you and you can spend much of your time formatting files. It might be useful to create some utilities to automatically convert your data into the right format or request your data in a particular format.
| Browser Based Help. Published by chm2web software. |