File Menu
The File menu contains the following options:
Open STEMgis Database, Open STEMgis Workspace, Save STEMgis Workspace, Publish View to SVG File, Open STEMgis Map File, Open SIPS Image, Create SIPS Image From File , Import Layer, Export Layer, Export Map View, Export Animation, Logon To Security Level, Print Standard Layout, Print Layout Designer, Exit
This menu item allows the user to open an existing STEMgis database for use in STEMgis Viewer. Any previously open database is automatically closed but any data recovered from the now closed database remains in memory until that layer is deleted and may be animated, graphed etc. If a map layer previously recovered from a closed database contains features without attributes then right clicking on a spatial feature in the map window will not recover the summary data. However, if the feature has associated attributes then right clicking on a spatial feature will recover the summary information.
To create a new STEMgis database use the STEMgis Manager.
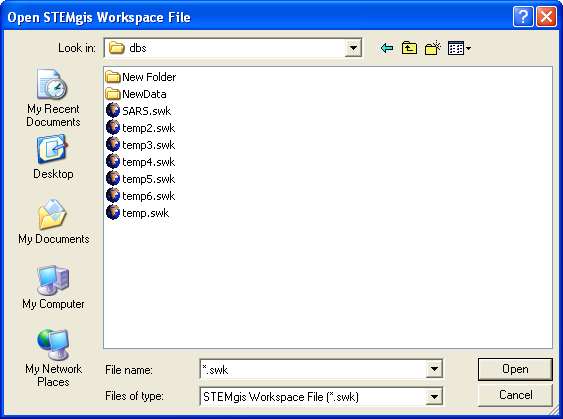
This menu item allows the user to open a STEMgis workspace file. Workspace files contain saved map layers that a user may have built up during a previous session. These files save the user from repeating the query process every time they execute the Viewer. After selecting the menu item simply select a workspace file using the Windows file browser. STEMgis workspace files have the extension .swk.
This menu item allows the user to save a STEMgis workspace file. Query information relating to all of the currently loaded map layers are saved to the file. The select area and zoom area are also saved to the file so that the Viewer will appear as it was when the file was saved. Any views and albums that the user has created will also be saved to the Workspace file.
After selecting the menu option use the Windows file browser to save the file.
Scalable Vector Graphics (SVG) is a format for displaying 2D vector data of the web. This menu item enables the user to publish their data on a web page. Three files are produced for each SVG publication, a HTM file which is the web page within which the SVG data appears, a SVG file which contains the map data, and a JS (JavaScript) file which contains attribute data and user interface controls which appear on the resulting web page.
After selecting the Publish View to SVG File menu item the following dialogue box appears:
This dialogue allows certain parameters to be defined. The size drop-down list allows the user to select a nominal size in pixels for the map produced (N.B. this can in fact be overridden by manually editing the height and width parameters within the EMBED tag in the htm file). The next three text boxes enable the customization of names for the 'Coastline' or default map layer, the current layer, and the map title that appears above the map window area. The map title can also be linked to a web page by providing a URL in the Web link for title text box.
The Hide attribute selection box can be checked if the attribute drop down box is not required on the SVG page. The Millisecond delay is used to define an interval between timeslices in an animation. This is not an accurate measure however, as the browser will take a certain length of time to render each timeslice - the milliseconds that are specified are then added on to this unknown time. It is therefore worth experimenting with this delay factor to achieve the desired result.
The Title to appear in HTML file is the title that appears in the window bar at the top of the browser window.
Instructions that appear in the SVG file can be shown in English or French at present. The Language drop down list can be used to select the desired option.
Note: The SVG facility does not, at present, publish layers that have multi-temporal spatial data or raster data.
STEMgis Map files are generally used to define a coastline file that is loaded each time the Viewer is executed (see creating a map file). However, these files may also be loaded as a separate layer using this menu option. Use the Windows file browser to select the file you wish to load.
This menu item allows the user to import a STEMgis format image file which is loaded directly into a map layer. SIPS images are created using the map export tool or the Create SIPS Image From File menu item.
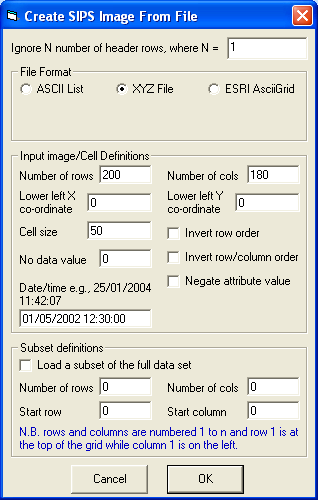
This menu item allows the user to create a STEMgis format image file from ASCII data files or ESRI ASCIIGrid files. After selecting this menu item you will be asked to select a file using the standard Windows file browser and then the following form will appear.
There are three different formats that can be used to create a SIPS image. The ASCII list format is simply a file containing columns of data. The XYZ format is three or more columns of data where the first column describes the X co-ordinate, the second describes the Y co-ordinate and the others specify the Z (or attribute/pixel value) components. The ESRI ASCIIGRID format is a ASCII description of a grid defined and published by ESRI. The latter format provides all of the geometric properties that STEMgis needs to import the data, however, you may also specify a date/time to be associated with the image and you may also specify whether you wish to invert the attribute values.
You must specify other parameters for the other two formats, namely, the number of rows and columns for the new image, the lower left map co-ordinates (N.B. these are given in terms of the currently displayed map projection), and the cell size. Your data files may include header information. This can be skipped over by giving a value in the Ignore N number of header rows text box.
If you XYZ file contains more than three columns then you can specify whether you wish to read in all columns or which individual column you wish to import. To specify one column of data type in the column number. To read in all columns and create a SIPS image with more than one band, type in an asterisk in the text box shown below.
Once you click on OK the data will be imported into a new layer within the Viewer.
This menu item allows the user to import map data from an external file format. STEMgis will read the following formats:
After clicking the Import Layer menu item or the Import Layer toolbar icon the following import window appears:

The user must then click on either the Vector or Image buttons to import the file of their choice.
Importing Vector Maps
After selecting the vector file STEMgis reads the vector data and any attribute information, if present, and displays the results in the import window:

Some import formats may include more than one layer, e.g. DXF. Select the layer that you wish to import by clicking on the appropriate checkbox in the upper-left grid. To view a particular layer, left-click on the required layer and then click on the Draw Layer button. To view all layers click on the Draw ALL button.
Individual spatial features may be included or removed from the import by double-clicking on the appropriate checkbox in the lower-left grid. To view an individual feature simply left-click on the any feature within this grid.
Before importing the layer into STEMgis you must specify the co-ordinate system of the import data. Use the Current Co-ordinate System treeview to select the co-ordinate system of your file.
To import any attributes that might be included with the import file(s) click within the checkbox of the required attributes in the lower-centre grid. At present, the number of attributes that can be imported in this way are limited to five.
To import and view the data within STEMgis, click on the IMPORT LAYER button. You must then provide some additional information in order that STEMgis can use the data appropriately and also have enough information to load into a STEMgis database after being exported from the STEMgis Viewer.
The additional information includes:
1. Specifying a layer name that appears in the Layer Manager of the STEMgis Viewer.
2. Confirmation that the co-ordinate system is OK. If not then click on the Cancel button, re-specify the co-ordinate system, and click on the IMPORT LAYER button once more.
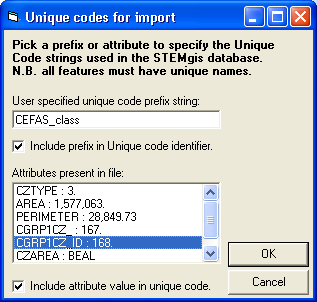
3. Unique codes are used internally within a STEMgis database to identify individual spatial features or objects. These features may change their spatial definition through time. Any attributes associated with them may also change through time. Every unique feature must have a unique code. A suitable code may already exist in the imported file, in which case the appropriate attribute column can be selected by clicking on the Attributes present in file listbox. Alternatively, the user can specify a prefix string in the upper textbox. An incremental number is appended to this string for each feature if an attribute is not chosen. If a prefix and an attribute is chosen then both string are concatenated to produce each unique code.
Note: If the unique codes are not unique this will only be picked if the user decides to load the imported layer into a STEMgis Databases. I.e. for simple viewing in the STEMgis Viewer the codes do not need to be unique.
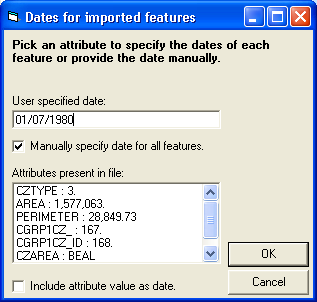
4. Specify a date for the spatial features or select an attribute column which specifies dates for each feature.
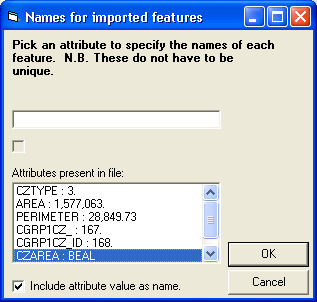
5. Specify an attribute to be used to as a name for a feature. This name is not the same as the Unique Code, it is the name that a user would see and does not have to be unique, e.g. many different polygons may represent the same town.
Importing Raster Maps
After selecting the image file STEMgis reads the raster data and any ancillary geographic information, if present, and displays the results in the import window:
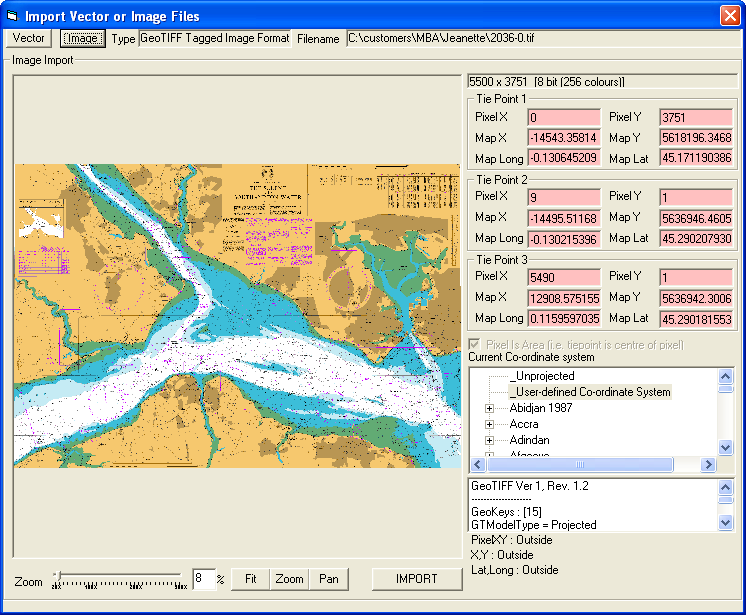
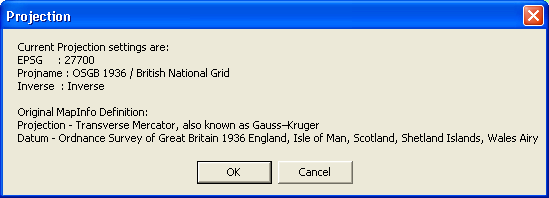
Geotiff files contain the necessary geographic information to define the image's projection and datum. Hence you do not need to change any information within the import window. Simply click on the IMPORT button to display the image within STEMgis. If the the projection/datum information stored in the GeoTiff image is not a recognized standard projection (i.e. one of the 2000 European Petroleum Survey Group projections) then the Projection Setup Dialog will appear. You will need to select a user defined projection that has been previously saved or define a new one. See the Projection Help for more information on creating user-defined projections.
Other image formats, such as JPG, TIF and BMP, do not include geographic information, so it must be provided during the import procedure. Firstly, select the co-ordinate system for the imported image from the projection treeview (n.b. if the projection does not exist in the treeview, click on _User-defined Co-ordination System and the Projection Setup Dialog will appear, which you can use to define a new projection). Secondly, define the co-ordinates of three points within the image. These may be three corners of the image or they may be three known points within the image, e.g. a road intersection. When using the corners of the image, simply type in the X and Y map co-ordinates of the corner for the appropriate Tie Point (N.B. the image co-ordinates are shown in the Pixel X and Pixel Y text boxes. When selecting points within the image, you must type in the image and map co-ordinates for each Tie Point. When the three points have been defined, click on the IMPORT button to display the image within STEMgis.
Note: The pixel size is assumed to be square. When calculating the map co-ordinates for the three tie points you must make sure that the differences in map units are proportional to the difference in pixel numbers in both the X and Y directions. For example, assuming Tie Point 1 is the upper left corner of the image and Tie Point 2 represent the lower right corner then the following must be true:
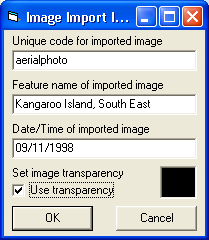
After clicking the IMPORT button, a number of details need to be specified:
The user must at least specify a date for the image. The above form also allows the user to specify a unique code, a feature name and a colour to use as the transparency colour (i.e. all pixels of this colour are considered transparent). To change the transparency colour double-click on the colour box.
Note: If STEMgis is not currently using the projection of your imported image then the new image layer will be switched off. To view the image change the current projection to that of your imported image.
Allows the Active Layer to be exported (saved) to a file whose type is determined by the contents of the layer as follows:
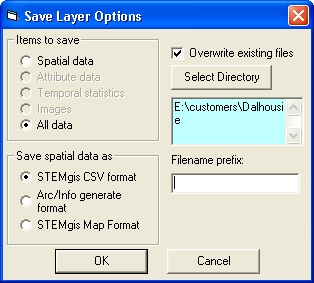
The Export (Save) Layer options are available in the following dialog box.
The Save Layer Options box allows spatial data to be saved either in STEMgis CSV format, STEMgis Map Format, Arc/Info Generate format or Windows Bitmap Format. A filename prefix should be entered but not the file extension, i.e. do not add .csv or .gen. The appropriate extension will be added automatically for the chosen format.
The Items to save options available to the user will depend on the contents of the layer. For example, when exporting a point dataset with attributes, the Spatial data, Attribute data, Temporal statistics and All data option will be enabled, with All data selected as default. If All data is selected then 3 different files will be created:
Other STEMgis layers will produce a different combination of files, e.g. a layer with different spatial types will export a different CSV files for each type.
ARC/INFO generate files may be used within ESRI GIS products.
STEMgis Map files are used as a command line option for the STEMgis Viewer to specify a default map layer that appears every time the Viewer is executed. These files may also be imported as a map layer via the File menu.
Allows the Map Window to be exported (saved) to a .bmp file. The size of the image may be reduced by entering a Factor >0 and <=1.0 where a factor of 1.0 represents the original picture dimensions which are shown in pixels. Click on the Write Image button enter a filename and choose the sub-directory in which the file is to be saved.
Allows an animation based on the currently selected map layer to be exported (saved) to a .avi file. The size of the image may be reduced by entering a Factor >0 and <=1.0 where a factor of 1.0 represents the original picture dimensions which are shown in pixels. Choose between 8 or 24 bit export and set the number of frames per second (1 to 30) to be used when replayed. Click on the Write AVI button enter a filename and choose the sub-directory in which the file is to be saved.
Data within a STEMgis database can be assigned to different levels of security for the purposes of data confidentiality or for copyright and other legal reasons. These levels are assigned to each feature type and consist of a pubic level and two further levels for which passwords are required. If a user tries to retrieve data for which they do not have permission, they will be asked for a password. Providing the correct password will continue the query, otherwise the query will be aborted.
An alternative method of logging onto a specified security level is provided by this menu option which invokes the following form:
The user must enter the correct password for the desired security level.
Prints a copy of the current map view. Use the standard Windows print dialog box to select the printer and paper properties.
STEMgis prints the current map view, the key of the currently selected layer, a north arrow, and a scale bar. The layout is slightly different for portrait and landscape views. The following figure shows the landscape layout.
Invokes the Print Designer, which can be used to design customized layouts for printing static and multitemporal maps.
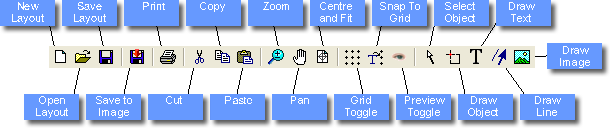
The Print Designer can be used to create any customized page layout containing maps, legends, text, graphics, scale bars and north arrows. Much of the functionality of the Designer is accessed through the toolbar, which is highlighted below:
The Designer can create a new layout, open an existing layout or save a layout that has been created. These are saved as .ply files on your system.
Note: It is best to select your printer and page orientation before you start designing the page.
Each element on a page is treated as an object. The properties of each object can be changed to produce the desired layout. For instance, an object might be a map, a scale bar or a piece of text. Use the Draw Object button to draw any number of empty objects on the page. To change the properties of an object select it by left-clicking on the object and then right-clicking on it to invoke the properties page.
Note: Turn on the Show Grid and Snap to Grid options if you wish to line objects up quickly and accurately. This will snap objects to whatever distance you have specified (e.g. every 5mm in the example above).
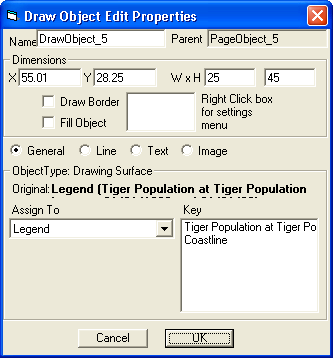
An object may be one of four types - general, line, text or image (use the appropriate icon on the toolbar to draw the desired object). A general type is basically a map component such as a current map view, a legend, a north arrow, a scale bar, or a temporal map. Select the desired sub-type from the drop-down list. Two of these sub-types, namely legend and temporal maps contain further options to define the layer required in the legend and the date/time slice required for the temporal map. These are shown below.
Any number of each of these object types may be placed on the page. In this way you can print the legends of each relevant layer and produce a number of temporal maps on one page.
Each object can have a border and/or fill that can be turned on or off. To change the styles and colours right click on the box in the centre of the page. To position an object accurately on the page edit the X, Y, width and height text boxes.
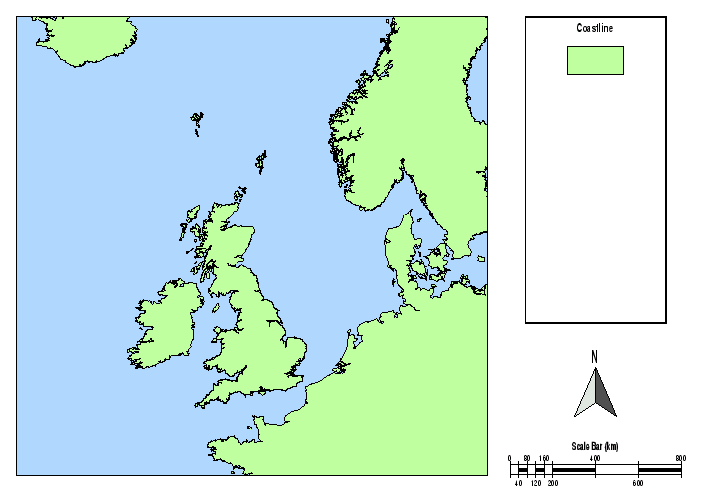
A completed page layout might look something like this:-
Speed considerations
Depending on the kind of objects you are drawing you might find that editing takes a long time due to the constant redrawing of the objects. To avoid this click the Preview button on the toolbar. By doing this the Designer will simply draw text describing the object and borders (if they exist), which can be much quicker than rendering all of the objects.
Output
Once you are happy with your layout you can either print it out or save it as an image, using the icons of the toolbar. Remember to save your layout if you wish to use it again.
Note: A saved layout simply contains references to temporal maps and the date that was used. If you close STEMgis down and reopen it, you must have the same current layer and the same dates to produce the same page layout as previously saved. The layout will also draw the current map extent and scale, which may also have changed after restarting STEMgis.
A page layout saved as an image (N.B. you can save the image as any number of dots per inch to change the image's resolution) is shown below.
Closes and exits the STEMgis Viewer.
| Browser Based Help. Published by chm2web software. |