|


|
STEMgis SVG Online Help
The SVG maps produced by STEMgis are designed to replicate the STEMgis Viewer. The user interface includes a toolbar, a layer manager, map area, locator map, legend, time and height/depth bars, and tools to change layer properties and to view time series or height/depth profiles of attribute data. A small amount of help is provided in a message area below the map help you use the SVG maps, however, this page provides a more detailed description of the interface.
Toolbar
The image on the right shows the buttons available on the toolbar. From left to right:
Zoom In: Clicking on this buttons zooms into the map by a factor of two and is centred on the centre of the current view.
Zoom Out: Clicking on this buttons zooms out of the map by a factor of two and is centred on the centre of the current view. You can only zoom out to the full extent of the map, which is shown in the locator window.
Zoom to full extent: Zooms to the maximum extent of the current map. This is defined when the SVG file is created in STEMgis.
Run: This button will start an animation if one is available for the currently selected layer. The current layer is typically shown as dark blue in the layer manager.
Stop: Click on this button to stop an animation.
Help: Display this help page. |
 |
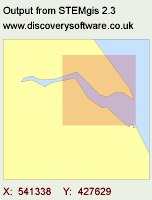
Locator Window
To the upper right of the map area is the locator window. This indicates the full extent of the map and illustrates where you are currently zoomed into using a transparent red box.
Once you are zoomed in past you can pan (or move) around the map at the level of zoom by holding down the left mouse button on the red box and dragging it to a new location. The main map view will then show the new area at that zoom level.
The number below the locator map show the map co-ordinates of the cursor, so as you move your cursor over the main map area you can tell you position in the units of whatever map projection has been used to create the map.
|
|
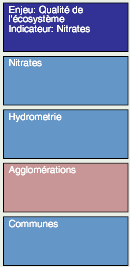
Layer Manager
To the left of the map area lies the layer manager. This consists of a number of differently coloured boxes representing each map layer. Each layer has three possible states:
- Dark blue - layer is turned off and is the current layer, which means that the legend, time bar, height/depth bar, layer properties all relate to this layer.
- Mid blue - layer is turned on
- Pink - layer is turned off
To change the current layer you can simply left-click on a mid blue layer, i.e. one that is currently turned on.
To turn a layer on or off, hold down the Shift key and left click on the layer.
You can also change the display properties of a layer by holding down the Control key and left clicking on a layer (see below for layer properties). |
|
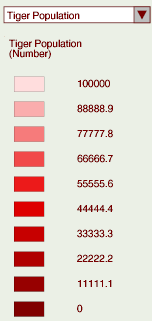
Legend
The legend for the current layer is shown to the right of the map. The style of the legend will depend on the data stored in the current layer and the visualization method.
If the current layer contains more than one attribute then a drop down list will be displayed above the legend. Click on the down arrow to view the list and then click on the attribute name to change the 'current attribute'. When data are displayed as proportional symbols only the current attribute is displayed on the map. When bar charts, pie charts, speedometer charts, or wind roses and used to visualize the data then more than one attribute is displayed on the map. The legend will then indicate symbols appropriate for each attribute. |
|
Time bar and height/depth bar
If a the current map layer has more than one time slice then a time bar will appear below the map area. The boxes shown in the time bar represents each time slice. You can click on each box to change the current time being displayed on the map.
During an animation you may notice that the black border surrounding the box representing each time slice becomes thicker. This illustrates the current position during an animation.
The colour of the boxes indicates the relative value an attribute for each time slice and for all locations during that time slice. The colour scale range from low (dark blue), through medium (cyan), to high (red). If there are no data for a particular time slice or height/depth then the colour of the box will be dark grey (as in the fifth box from the left in the image below).
If the current layer also contains attribute data that vary with depth as well as time then a button will appear to the left of the time bar (see example below). Click on this icon to switch to the height/depth bar and click again on the clock button to switch back.
The height/depth bar behaves in the same way as the time bar in that you can click on any box to show the data for that height/depth. Please note that if you click on a depth and then return to the time bar, the time bar will show values for the new depth and vice versa.
|
|

|
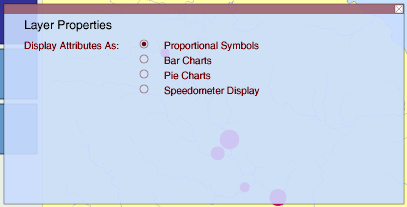
Layer Properties
You can change the properties of the current layer by holding down the Control key and left clicking on the layer. This opens up a transparent form as shown on the right.
Click on the option button next to the display technique you would like.
The form may be closed by clicking on the cross in the upper right corner or may be moved by holding down the left mouse button on the red bar at the top of the form and dragging the window to a new position. |
|
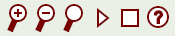
Graphing time series and height/depth profiles
You can click on a spatial feature in the main map area to display the attribute data stored for that site. The spatial feature might be a point, line, or polygon.
By default a time series is shown for all attribute values at that site.
If the current layer has height/depth data and the height bar is currently displayed then the graph will show the attribute values versus height/depth rather than versus time.
You can close and move the graph window in the same way as the properties window (see above) .
For a multi-attribute graph some attributes may need to be scaled to plot on the same axis. This is indicated in the legend to the right of the graph (e.g. Alkalinity (x2)). |
|
|