Draw Transect
There are two types of transects that can be produced, both of which produce a transect plotted in the graph tool. The first type is a Linear Transect where the user draws a line and border within the map window to capture points for the transect. The second type is a Non-linear Transect that follows a linked route through a set of spatial features or the path of a raindrop falling on a terrain if used with a 'real' raster dataset.
Linear Transect
To draw a transect, click on the Draw Transect
tool icon ![]() in the Tool
Bar. This icon will be highlighted only when an Active
Layer is present in the Layer Manager.
The Specify Transect dialog box will appear with
the Manually specify transect using the cursor
option set by default and the other entry fields greyed out. Click OK
to proceed with manual drawing of the transect (see below: Mechanics of Drawing
a Transect).
in the Tool
Bar. This icon will be highlighted only when an Active
Layer is present in the Layer Manager.
The Specify Transect dialog box will appear with
the Manually specify transect using the cursor
option set by default and the other entry fields greyed out. Click OK
to proceed with manual drawing of the transect (see below: Mechanics of Drawing
a Transect).
To specify a transect by entering numerical co-ordinates uncheck the Manually specify transect using the cursor check box. The Start Point, End Point and Border Width entry fields will become active and numerical values that define the required transect and its buffer zone should be entered. This means of defining a transect is useful for repeated use of a precise location which may be required over several different layers or on different locations.
Mechanics of Drawing a Transect
1. To draw a transect, first position the cross-hair cursor where the transect is to start and left-click on the mouse.
2. Move the cursor to the end of the transect line and left-click again.
3. Finally, move the cursor in a perpendicular direction to the transect to define a buffer around the transect. All data points found within this buffer zone will be included in the transect plot. When the required transect buffer area has been drawn left-click to define the selection.
Examples using the Draw Transect tool
The example below shows a transect drawn across the Mersey Estuary through bathymetry data that covers 4 time intervals between 1906 and 1997.
The resulting transect across the estuary for 1851 (the time interval selected on the Time Bar as shown above immediately below the Map Window) is displayed in the Graph Window.
![]()
All other transects i.e. up to 1998 can be added by selecting the Transect menu and the Show all dates option in the Graph Tool window. The data can be displayed as lines by selecting the Properties menu and the Lines only option.
![]()
More details on the use of the Graph Tool can be obtained by clicking this link.
There are two distinct uses of this tool. For vector data, a non-linear transect provides a plot of attribute values along a route of linked spatial features. Examples of such routes might include the downstream flow of a river, or the flow of traffic on a road or railway. For 'real' raster datasets the tool follows the steepest path through a terrain until it finds a height of zero. For a grid of topography this is analogous to dropping a raindrop on a spot in the terrain and following its path to the sea.
Vector Data
To draw a non-linear transect click on the Draw Transect
Route tool icon ![]() in
the Tool Bar. This icon will be highlighted only
when an Active Layer is present in the Layer
Manager that contains spatially linked features. After clicking on the icon,
click on a point, line or polygon at which you wish to start the transect. A
graph will be produced showing all of the 'downstream' attribute values from the
chosen spatial feature. Links can be made between different feature types, so
if these feature types have been integrated within the same query and therefore
also within the resulting map layer, the transect can be made to flow across
feature type boundaries.
in
the Tool Bar. This icon will be highlighted only
when an Active Layer is present in the Layer
Manager that contains spatially linked features. After clicking on the icon,
click on a point, line or polygon at which you wish to start the transect. A
graph will be produced showing all of the 'downstream' attribute values from the
chosen spatial feature. Links can be made between different feature types, so
if these feature types have been integrated within the same query and therefore
also within the resulting map layer, the transect can be made to flow across
feature type boundaries.
The example below shows a river network of linked points and the resulting non-linear transect from one of the points on the southern river.
Note: Both rivers are linked to the estuary, so a transect from either river will include data from the estuary.

Raster Data
When the current active layer is a 'real' raster layer the non-linear transect tool can be used to simulate a raindrop's path through the gridded data. After clicking on the Draw Transect Route tool icon ![]() a graph showing the 'downstream' profile will be displayed:
a graph showing the 'downstream' profile will be displayed:
![]()
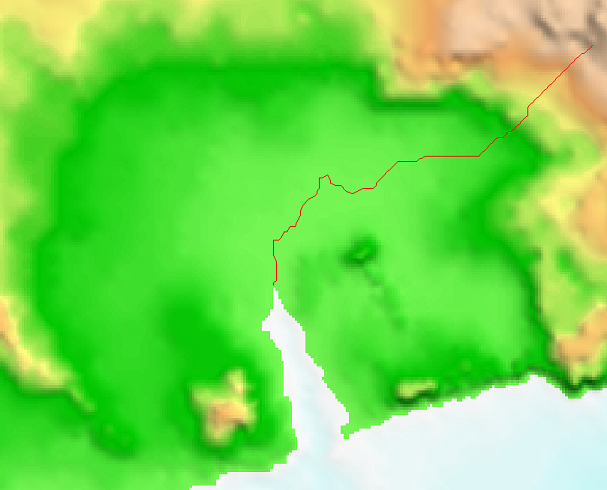
The planimetric path of the raindrop through the grid will also be shown on the map as a red line:
| Browser Based Help. Published by chm2web software. |