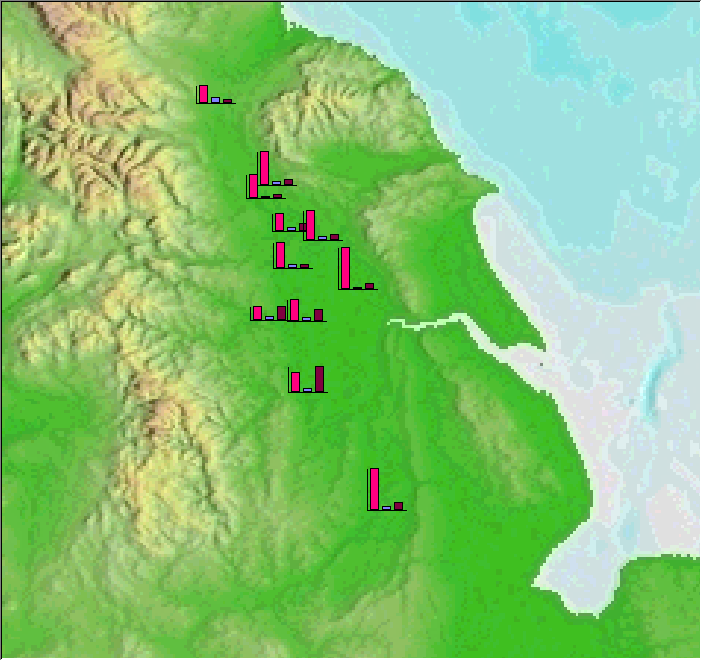
Map Window
The Map Window forms the major part of the STEMgis main window. The Map Window and the Graph Tool provide the primary means by which the STEMgis Viewer presents retrieved data in a mapped or graphical form. Retrieved data may be arranged in a number of layers which are shown in and managed by the Map Layer Manager. The geographical location of the data displayed in the Map window will be indicated in the Locator Map.
The information displayed within the Map Window is controlled by a number of different facilities such as Zoom In, Zoom Out, Pan and the Properties options within the Map Layer Manager which control Scaling, Colour and Plot Options.

The data available at a particular location can be viewed in tabular format by positioning the mouse pointer over the required point (for histogram data this should be the origin) and clicking the right mouse button. Repeat this sequence to see the tabulated data at other sites.
If you right-click on a feature in a layer without attributes, retrieved using the Draw Features option in the Query Wizard, then STEMgis queries the database to discover what attributes are present for the selected feature. A table appears detailing the attributes, their date range and the number of values existing within that date range for the selected site only:
If the feature has associated metadata then the resulting window will also display a Metadata button. Click on this button to view the associated metadata.
All metadata for the currently selected feature or attribute will be displayed as shown below.

| Browser Based Help. Published by chm2web software. |